New report details how prisons and jails have misused money in "Inmate Welfare Funds" to pay for bounce houses, ham gift cards, and even shooting range memberships.
May 6, 2024
Easthampton, Mass. — In virtually every state, incarcerated people and their families subsidize the operation of prisons and jails when they pay for phone calls and commissary items, or make deposits into their loved ones’ accounts. While prison profiteers like Securus and Keefe Group are now well known, less widely known is that the money families pay to these companies is shared with prisons and jails themselves — and kicked back into so-called “Inmate Welfare Funds” with little accountability or transparency.
This morning, the Prison Policy Initiative released a new report called Shadow Budgets: How mass incarceration steals from the poor to give to the prison. Our report finds that at least 48 state prison systems and the federal Bureau of Prisons have “Inmate Welfare Funds,” and lays out how these accounts — which often receive millions of dollars a year — are used. We found that all too often, this money:
Is used to pay for capital projects, such as prison construction, or for basic essentials for incarcerated people — items that prisons and jails should be paying for
Is governed by loose regulations, under which virtually any spending is “justified”
Sits unused despite an urgent need for in-prison programming
While the focus of Shadow Budgets is on prisons, the report also collects anecdotes from welfare funds in local jails. This evidence suggests jails are prone to using incarcerated people’s money in even more egregious ways than prisons, with expenditures like:
$40,000 on gift cards to The Honey Baked Ham Company for jail staff (Fulton County, Georgia)
$300,000 on gun range memberships for staff (Dauphin County, Pennsylvania)
$217,000 on guns, bullets, and vests for law enforcement (Pinal County, Arizona)
“Welfare funds are yet another example of how our failed system of mass incarceration burdens the poorest members of society the most,” said report author Brian Nam-Sonenstein. “Prisons and jails need to be held accountable for how they use welfare funds to fill budgetary gaps — and when their budgets fall short, they should be incentivized to decarcerate facilities rather than exploit poor families.”
Our report lays out policy recommendations for state and local governments to end the worst misuses of welfare funds while protecting the basic needs they all too often pay for. In particular, it urges states to ban the use of welfare fund money for construction or staff costs, to meet incarcerated people’s needs through the general appropriations process, and to guarantee that incarcerated people and their families have a say in how welfare fund money is spent. Above all, though, the report emphasizes that prisons and jails should focus on reducing the number of people behind bars to address budgetary shortfalls rather than sapping money from incarcerated people and their families to fill the gap.
In our report and companion guide for press, we encourage journalists to investigate the welfare funds in state prisons and particularly in local jails. We make details about every state prison system’s welfare fund available in Appendix A, explaining how these funds are accrued, spent, and overseen. Meanwhile, Appendix B lists some specific examples of expenditures, prohibited expenses, and regulatory language across the various welfare funds we investigated. For those interested in investigating welfare funds in local jails, Appendix C contains a list of state statutes, some of which apply to sheriffs and county facilities.
We offer lessons learned from developing our new report, Shadow Budgets, to encourage journalists to investigate welfare funds in their local prison or jail systems.
Our new report Shadow Budgets: How mass incarceration steals from the poor to give to the prison explains that prisons and jails squeeze revenue out of incarcerated people and their families via paid telecommunications services, commissaries, money transfers, and disciplinary fines, then funnel it into “Inmate Welfare Funds” and use the money to cover the costs of incarceration. While corrections officials claim that these funds go to benefit incarcerated people, money from these accounts often sits idle — or worse, is spent on perks for correctional staff, like special meals or gun range memberships. Even when the funds are put toward improving conditions behind bars, the spending typically meets a need that can and should be paid for out of the agency’s general budget — not money extracted from incarcerated people.
Shadow Budgets identifies welfare funds in 49 prison systems, explains what rules govern these funds, and discusses some of the ways this money has been misused. As we discuss in the report, however, inmate welfare funds are not as transparent or accountable as general correctional budgets. Outside actors like state auditors — and investigative journalists — play a key role in uncovering how states and counties use this money. In this blog post, we offer lessons learned from developing our report to encourage journalists to investigate these funds in their local prison or jail systems.
Investigating welfare funds: what records to request, and how
Not all jails and prisons have welfare funds, and those that do may call it something else. In some places, they don’t appear to have formal names at all. (And while most funds draw revenue from commissary and/or telecom services purchases, some may have other sources.) If Appendix A of our report doesn’t provide these details about the jail or prison system you’re investigating, you can call the agency itself and ask. You might want to ask where kickbacks from telecom and commissary services are deposited, or whether there is a fund for the general welfare or benefit of the incarcerated population. Alternatively, you can consult county, municipal or state policies (for example, this one for the Michigan Department of Corrections). Information about funds in local jails may also be listed in state correctional standards, if you live in a state where the department of corrections has authority over jails.
The most important questions you’ll investigate about the welfare fund are: How much money is in the fund, how is it being spent, and who gets to decide? You will likely have to submit a public records request to find out; for tips on filing public records requests to corrections agencies, see our records request guide.
Specifically, we recommend that you request:
An itemized list of purchases made from the inmate welfare fund (try to go back two or three years, if possible, to get a representative dataset).
Balance sheets for the account. As we discuss in our report, many if not most prison systems sit on large amounts of revenue even as key programs for incarcerated people go underfunded. The balance sheet will show if the jail or prison is actually using the money. Again, asking for a few years of data will help understand whether balances are carried over.
Any audits or fiscal reports on the funds. Depending on your county and state, you may instead want to request this information from the auditor’s office, the county/city board or council, or the state department of corrections. (The state or local policies governing the welfare fund should tip you off as to what agency to reach out to about audits and fiscal reports.)
If the fund has an oversight committee — which should be mentioned in the state/local policies discussed above — request information about how often the committee meets, when its last meeting was, and who sits on the committee. If the jail or DOC cannot provide this information, it’s possible that the committee is not active. (On the other hand, if the committee is active, consider contacting them as a source for your story.)
You may also want information about the sources of money in the fund. In particular, we advise locating the jail/prison’s contracts with its commissary or telecom providers, where agreements about revenue-sharing are typically laid out. We’ve made hundreds of contract documents available to the public in our Correctional Contracts Library.
We also suggest asking the jail or prison whether incarcerated people have any say in how the inmate welfare fund is used. Since these funds are theoretically dedicated to benefiting incarcerated people, and are paid for by incarcerated people, it’s good to know to what extent administrators consider their input.
How to assess uses of welfare fund money
Most jails and prisons have regulations or statutes governing what the money in their inmate welfare fund may be used for. (Appendix A of our report contains details on the rules in several prison systems.) Sometimes, corrections officials use the money in ways that may violate these rules, like Pinal County, Ariz. Sheriff Mark Lamb, who spent $200,000 in revenue from jail phone calls and commissary services on “guns, bullets and vests” for law enforcement officers. John Washington of Arizona Luminaria, who broke the story, found that the state statute governing the welfare fund only allowed the money to be used for “the education and welfare of inmates.”
It’s worth noting, however, that the Pinal County Jail’s fund also paid for “recreational equipment, clothing, and internet services for people who are incarcerated.” These kinds of expenditures are legal under Arizona’s statute, but they are not laudable uses of poor people’s money. Jails have a responsibility to make sure the people in their care are clothed. And to the extent that “internet services” are necessary for people in jail to have access to law libraries and the courts, they are a constitutional right, not a privilege.
When assessing uses of welfare fund money, consider the following questions:
Is the jail or prison forcing incarcerated people to cover the cost of their own basic needs?
Is it appropriate to force many of the lowest-income people in the county or state (i.e. the majority of people in jail, and their families) to pay for these things?
Why is the county or state not paying for these goods, services or programs out of its general budget?
Keep in mind that it’s not always easy to tell whether uses of these funds are legal or not. As we discuss in our report, many state statutes include wiggle words like “primarily” or “including but not limited to,” effectively giving corrections officials free rein to spend the money any way they like. Just because an expenditure is technically legal, of course, doesn’t mean it is right.
Who else to talk to
Incarcerated and formerly incarcerated people and their families
If you’re able to contact people behind bars or their loved ones, ask them whether they have heard of the inmate welfare fund (make sure to use whatever term the jail or prison uses). You can also ask if they know of any programs or benefits for incarcerated people paid for with that money.
In writing Shadow Budgets, we talked to several formerly incarcerated people and advocates for incarcerated people about their views of welfare funds. Many saw the funds as regressive and exploitative, while many also worried about them being dismantled, and were concerned that if they did not exist, the needs met with those funds would go unfulfilled. While there is no easy answer for what to do about these funds, incarcerated people’s perspectives are crucial to understanding what the funds are or are not accomplishing.
State and local elected representatives
It’s likely that many elected lawmakers will never have heard of inmate welfare funds before. Nevertheless, because the funds are governed by state and local regulations, lawmakers can and should be held accountable for inappropriate uses of the money.
We also suggest asking state elected officials broader questions about welfare funds, such as:
Are you concerned about prisons and jails having large discretionary budgets that are outside the purview of the legislature?
Why does the state not choose to fund these services and programs with money from the regular appropriations process?
Recommended reading: investigative journalism about inmate welfare funds
These stories focusing on or involving welfare funds may give you other ideas about questions to explore, or sources to contact for your story:
PennLive’s 2023 investigation into the Dauphin County Jail’s use of telecom and commissary revenues (via the jail’s welfare fund)
Pacific Sun’s 2022 reporting on the welfare fund in the jail in Marin County, California
WSB Atlanta’s 2023 story about misuses of money in the Fulton County Jail’s welfare fund
Arizona Luminaria’s storyseries about Pinal County Sheriff Mark Lamb’s use of welfare fund money to buy guns and ammunition for law enforcement
Much like other aspects of prisons and especially of local jails, inmate welfare funds are rich territory for journalistic investigations because they have so little transparency. Unless state or local lawmakers request visibility into these funds, they can be spent more or less however correctional officials wish, meaning that hundreds of millions of dollars in public spending nationwide is virtually unaccounted for. By investigating welfare funds, journalists can shine a light not only on a little-known form of public spending, but also on the broader priorities of jail and prison officials. Transparency into these funds can spark important conversations about whether these officials’ stated commitment to incarcerated people’s wellbeing is reflected in their use of resources.
If you’re a journalist and have any questions about our report or about this guide, please don’t hesitate to write to us through our contact page.
We've updated the data tables and graphics from our 2017 report to show just how little has changed in our nation's overuse of jails: too many people are locked up in jails, most detained pretrial and many of them are not even under local jurisdiction.
One out of every three people behind bars is being held in a local jail, yet jails get almost none of the attention that prisons do. In 2017, we published an in-depth analysis of local jail populations in each state: Era of Mass Expansion: Why State Officials Should Fight Jail Growth. We paid particular attention to the various drivers of jail incarceration — including pretrial practices and holding people in local jails for state and federal authorities — and we explained how jails impact our entire criminal legal system and millions of lives every year. In the years since that publication, many states have passed reforms aimed at reducing jail populations, but we still see the same trends playing out: too many people are confined in local jails, and the reasons for their confinement do not justify the overwhelming costs of our nation’s reliance on excessive jailing.
People cycle through local jails more than 7 million1 times each year and they are generally held there for brief, but life-altering, periods of time.2 Most are released in a few hours or days after their arrest, but others are held for months or years,3 often because they are too poor to make bail.4 Fewer than one-third of the 663,100 people in jails on a given day have been convicted5 and are likely serving short sentences of less than a year, most often for misdemeanors. Jail policy is therefore in large part about how people who are legally innocent are treated, and how policymakers think our criminal legal system should respond to low-level offenses.
Figure 1. The frequent practice of renting jail cells to other agencies makes it difficult to draw conclusions from the little data that is available. This update to our 2017 report offers an updated analysis of national data to offer a state-by-state view of how jails are being used and we continue to find that pretrial populations continue to drive jail growth across the country. The data behind this graph is in Appendix Table 1.
Pretrial policies have a warehousing effect
The explosion of jail populations is the result of a broader set of policies that treat the criminal legal system as the default response to all kinds of social problems that the police and jails are ill-equipped to address. In particular, our national reliance on pretrial detention has driven the bulk of jail growth over the past four decades.
More than 460,000 people are currently detained pretrial — in other words, they are legally innocent and awaiting trial. Many of these same people are jailed pretrial simply because they can’t afford money bail, while others remain in detention without a conviction because a state or federal government agency has placed a “hold” on their release.
Pretrial detention disproportionately impacts already-marginalized groups of people:
Low income: The median felony bail amount is $10,000, but 32% of people booked into jail in the past 12 months reported an annual income below $10,000.
Black people:43% of people detained pretrial are Black. Black people are jailed at more than three times the rate of white people.
Health problems:40% of people in jail reported a current chronic health condition. 18% of people booked into jail at least once in the past 12 months are not covered by any health insurance.
Mental illness:45% of people booked into jail in the past 12 months met criteria for any mental illness, compared to only 30% of people who had not been jailed.
Experiencing homelessness: While national data don’t exist on the number of people in jail who were experiencing homelessness at the time of their arrest, data from Atlanta show that 1 in 8 city jail bookings in 2022 were of people who were experiencing homelessness.
Lesbian, gay, or bisexual: 15% of people booked into jail in the past 12 months identify as lesbian, gay, or bisexual, compared to 10% of people not booked in the past year.
This confinement creates problems for individuals on a short-term basis and also has long-term effects. Research in different jurisdictions has found that, compared to similarly-situated peers who are not detained, people detained prior to trial are more likely to plead guilty, be convicted, be sentenced to jail, have longer sentences if incarcerated, and be arrested again. And these harms accrue quickly: being detained pretrial for any amount of time impacts employment, finances, housing, and the well-being of dependent children. In fact, studies have found that pretrial detention is associated with a decreased likelihood of court appearance and an increased likelihood of additional charges for new offenses. There is no question that wholesale pretrial detention does far more harm than good for an increasing number of people and communities.
Renting jail space: a perverse incentive continues to fuel jail growth
There are two different ways to look at jail populations: by custody or jurisdiction. The custody population refers to the number of incarcerated people physically in local jails. The jurisdictional population focuses on the legal authority under which someone is incarcerated, regardless of the type of correctional facility they are in. This means that there are people in the physical custody of local jails, but who are under the jurisdictional authority of another agency, such as the federal government (including the U.S. Marshals Service, immigration authorities, and the Bureau of Prisons) or state agencies (namely the state prison system). For example, immigration authorities can request that local officials notify ICE before a specific individual is released from jail custody and then keep them detained for up to 48 hours after their release date. These holds or “detainers” essentially ask local law enforcement to jail people even when there are no criminal charges pending.
State and federal agencies pay local jails a per diem (per day) fee for each person held on their behalf. For example, in 2024, the state Department of Public Safety and Corrections (prison system) pays local jails in Louisiana $26.39 per person per day, and more than 14,000 people in the Department’s custody were in local jails in 2022. The fees paid by different agencies to confine people in local jails range and depend on the contract between agencies: In 2023, the per diem rate negotiated between Daviess County, Kentucky and the U.S. Marshals Service increased from $55 to $70 per person per day. And these per diem fees can rack up quickly: in fiscal year 2021, the U.S. Marshals Service paid North Carolina counties more than $31 million for jail holds, while the Louisiana Department of Public Safety and Corrections spent more than $123 million on their “local housing of adult offenders” program.
In 28 states and the District of Columbia, more than 10% of the jail population is being held on behalf of a state or federal authority. This both skews the data and gives local jail officials a powerful financial incentive to endorse policies that contribute to unnecessary jail expansion. Local sheriffs — who operate jails that are rarely filled to anywhere near their total capacity with people held for local authorities — can pad their budgets by contracting out extra bed space to federal and state governments. To be sure, sharing some jail capacity can be a matter of efficiency: for example, if one county’s jail is occasionally full, borrowing space from a neighboring county may be better than building a larger jail. And, in some states — like Missouri — state law requires that local jails agree to hold people for state or federal agencies. But the systematic renting of jail cells to other jurisdictions — while also building ever-larger facilities in order to cash in on that market6— changes the policy priorities of jail officials, leaving them with little incentive to welcome or implement reforms.
In our 2017 report, we found this phenomenon was most visible in Louisiana, where the state largely outsourced the construction and operation of state prisons to individual parish (county) sheriffs.7 The most recent data suggests that as of 2022, Louisiana, Kentucky, and Mississippi stand out as the worst offenders. In all three states, at least one-third of the state prison population is actually held in local jails (53% in Louisiana, 47% in Kentucky, and 33% in Mississippi).8
Another major consumer of local jail cells is the federal government, starting with the U.S. Marshals Service, which rents about 26,200 jail spaces each year — mostly to hold federal pretrial detainees in locations where there is no federal detention center. In the District of Columbia, South Dakota, New Hampshire, and New Mexico, more than 15% of the statewide jail population was actually held for the U.S. Marshals Service in 2019. Meanwhile, Immigration and Customs Enforcement rents about 15,700 jail spaces each year for people facing deportation.9 In 2019, New Jersey stood out with 16% of the statewide jail population held for immigration authorities, followed by Mississippi (10%).
We should note there is significant geographic variation in just how much of a jail’s population is held for other authorities: more than a quarter of people in rural jails were held for state, federal, or American Indian and Alaska Native tribal governments in 2019, compared to only 11% of people in urban jails.10 The distribution also varies by state, as each has different levels of “excess” jail capacity, and federal officials have specific needs in different parts of the country.
The practice of holding people in local jails for other authorities carries significant personal, social, and fiscal costs, often exposing detained people to the harms of incarceration for longer periods of time than they would be otherwise. Jails are not designed to hold people for any significant period of time; they lack sufficient programming, services, and medical care to house people for months or years.11 This practice also contributes to jail overcrowding, which fuels jail construction and expansion in turn. As scholars Jack Norton, Lydia Pelot-Hobbs, and Judah Schept succinctly put it: “When they build it, they fill it, and counties across the country have been building bigger jails and planning for a future of more criminalization, detention, and incarceration.”
Contextualizing prison and jail population changes during and after the COVID-19 pandemic
Most of the data used in this report come from the Bureau of Justice Statistics’ Census of Jails, which was most recently administered in 2019 and published in 2022 (see the methodology for sourcing details). However, the prison population data used to create our state-specific graphics are from 2022 and reveal the dramatic impact of the COVID-19 pandemic on prison populations in many states over time. They show that state and federal prison admissions dropped 40% in the first year of the pandemic (2020). While not reflected in the 2019 data used in this briefing, we know that by June 2021, jail admissions were down 33% compared to the 12 months ending in June 2019. Before 2020, the number of annual jail admissions was consistently 10 million or more. Because these declines were not generally due to permanent policy changes, we expect that both prison and jail admissions will return to pre-pandemic levels as cases that were delayed for pandemic-related reasons work their way through the court system.
Recommendations
Our recommendations from 2017 remain just as relevant today, and can help state and local officials move away from using jails as catch-all responses to problems that disproportionately impact poor and marginalized communities:
Change offenses and how offenses are treated
States should reclassify criminal offenses and turn charges that don’t threaten public safety into non-jailable infractions.12
For other offenses, states should create a presumption of citation, in lieu of arrests, for certain low-level crimes.13
For low-level crimes where substance abuse and/or mental illnesses are involved, states should make community treatment-based diversion programs the default instead of jail.14 States should also fully fund these diversion programs.15
Help people successfully navigate the criminal legal system to more positive outcomes
States should immediately set up pilot projects to test promising programs that facilitate successful navigation of the criminal legal system. Court notification systems and other “wrap-around” pretrial services often increase court appearances while also reducing recidivism.16
Change policies that criminalize poverty or that create financial incentives for unnecessarily punitive policies
States should eliminate the two-track system of justice by abolishing money bail. States that are not ready to take that step should start by abolishing the for-profit bail industry in their state, and providing technical resources to existing local-level bail alternative programs to help these programs self-evaluate and improve state-level knowledge.17
Address the troubling trend of renting jail space
States should evaluate whether the renting of local jail space to state and federal authorities is steering local officials away from effectively addressing local needs.18
Updated state-specific graphics
In 2017, we argued that if lawmakers want criminal legal system reform, they must pay attention to jails. Years later, this remains true. To help state officials and state-level advocates craft reform strategies appropriate for their unique situations, this report offers updated data and state-specific graphs on conviction status, as well as changes in incarceration rates and populations in both prisons and jails.
The graphs made for this briefing are included in our profiles for each state:
Jails are, by definition, a distributed mess of “systems,” so accessing relevant data can be a challenge. Jails often hold people for other (state and federal) agencies and, at times, the numbers can be large enough to obscure the results of state- and local-level policy changes. For that reason, this report takes the time to separate out people held in jails for state prison systems or federal agencies, such as Immigration and Customs Enforcement, the Bureau of Prisons, the U.S. Marshals Service, and the Bureau of Indian Affairs.
Our national data come from our own analysis of multiple Bureau of Justice Statistics datasets. The National Jail Census series provides the most complete annual snapshot of jail populations. Our state-level data are from the Census of Jails for the years 1983, 1988, 1993, 1999, 2005, 2013, and 2019, and the Deaths in Custody Reporting series (now called Mortality in Correctional Institutions) for the years 2000-2004, 2006-2012, and 2014-2018. (We considered using the Annual Survey of Jails for our state-level data, but the Bureau of Justice Statistics explains that this dataset was “designed to produce only national estimates” and, after much testing, we concluded that this dataset could not reliably be used for state-level summaries.) There are no comparable data available for state-by-state jail population comparisons published more recently than 2019. 19
Jails — or facilities that serve the functions of jails — operate in all states, but in six states (Alaska, Connecticut, Delaware, Hawaii, Rhode Island, and Vermont) most or all of the jail system is integrated into the state prison system, so the “jail” populations in those states are not reflected in the federal data products on which this report relies (they are instead counted in the annual prison data). For that reason, we are unable to report state-specific data for those states, and those states are not included in the national totals reported in this report. Because these six states are relatively small in terms of population, we do not think their exclusion meaningfully impacts the national totals nor the much more important analysis of the trends within the national totals.
Many of our data sources are labeled on the individual graphics, but in some cases we had to combine multiple datasets or perform complicated adjustments where additional detail would be helpful to other researchers and advocates:
National data:
National number of people held in local jails for state and federal agencies (also referred to as “boarding” or “renting”):
National number of people held in local jails for all of the various federal authorities, including Immigration and Customs Enforcement (ICE), the Bureau of Prisons (BOP), the U.S. Marshals Service, and the Bureau of Indian Affairs: We have national-level data for 1983, 1988, 1993, 1999, 2005, 2013, and 2019. For those years, we used the National Jail Census series for the number of people held in local jails for the Bureau of Prisons or U.S. Marshals Service and for immigration authorities. For 2002-2005, 2007-2013, 2017-2018, and 2020-2022, the number of people held in local jails for immigration authorities comes from the Annual Survey of Jails series. For years between the National Jail Census series — when we were not able to find compatible data — we estimated the populations based on a linear trajectory. The estimates are noted in the appropriate appendix tables to differentiate them from the reported data from the Bureau of Justice Statistics.
National number of people held in local jails for state authorities: The Bureau of Justice Statistics, Prisoners series (1983-2022) publishes the number of people held in local jails for state authorities and this data is available for every year from 1983 to 2022. (This data point is also collected in the Census of Jails and the Annual Survey of Jails but we concluded, after much study, that the Prisoners series, based on data collected directly from states’ Departments of Corrections, was more reliable and more frequently collected and published.)20
National pretrial and jail sentenced populations: Total numbers for each category are reported in the National Jail Census series (1983, 1988, 1993, 1999, 2005, 2013, and 2019). We then adjusted the reported figures for the convicted and unconvicted populations to remove those held for other agencies from these jail totals. For years between the National Jail Census series — when we were not able to find compatible data — we estimated the populations based on a linear trajectory. The estimates are noted in the appropriate appendix tables to differentiate them from the reported data from the Bureau of Justice Statistics.
We removed 100% of people held for state prison systems (all of whom have been convicted and sentenced to prison terms) from the jail convicted totals (everyone else who has been convicted but not sentenced to prison).
We removed 34.1% of the people being held under the authority of Immigration and Customs Enforcement from the jail convicted population and removed the balance from the jail unconvicted population. (We based these percentages of the population held for ICE on our analysis of the Survey of Inmates in Local Jails, 2002. We found 34.1% of ICE detainees were there “to await sentencing for an offense,” “to await transfer to serve a sentence somewhere else,” “to serve a sentence in this jail,” or “to await a hearing for revocation of probation/parole or community release.”) This percentage calculation ignored any respondent who did not answer the question, and counted anyone who answered both a “convicted” and “unconvicted” status as convicted. We deliberately used this methodology which counts those awaiting revocation hearings as “convicted” because that matches the methodology used in our main dataset for this project: the National Jail Census. (Not surprisingly, since the people detained for ICE were answering a survey intended for criminal legal system populations, the leading response (41%) for ICE detainees about why they are being held in jail, after being read a list of statuses like “to serve a sentence” or “to await arraignment” was to answer “for another reason.”)
We removed 75.9% of the people being held for either the Bureau of Prisons or the U.S. Marshals Service from the jail convicted population and we removed the balance from the jail unconvicted population. (We based these percentages on our analysis of the Survey of Inmates in Local Jails, 2002 as described above for people detained for ICE).
State data:
Our historical, state-specific data on prisons, jails, and the changes in jail composition come from several different data sources:
For the state-level graphs on the jail and prison populations, the jail populations are based on the National Jail Census series for the years 1978, 1983, 1988, 1993, 1999, 2005, 2013, and 2019 and the Deaths in Custody Reporting series (now called Mortality in Correctional Institutions) for 2000-2004, 2006-2012, and 2014-2018. For years between the National Jail Census series — when we were not able to find compatible data — we estimated the populations based on a linear trajectory. The estimates are noted in the appropriate appendix tables to differentiate them from the reported data from the Bureau of Justice Statistics. As described above, our jail population totals were adjusted to remove people held for state or federal authorities in order to focus on those held by local authorities under local jurisdiction. The number of people in state prisons comes from the Bureau of Justice Statistics, Correctional Statistical Analysis Tool — Prisoners for 1978-2019 and Table 2 of Prisoners in 2020, Prisoners in 2021, and Prisoners in 2022 for 2020-2022. Of note, people sentenced for felonies in the District of Columbia were transferred to the Federal Bureau of Prisons as of December 2001, so there is no prison population or rate for the District for 2001-2022.
For the state-level graphs on jail and prison incarceration rates, for the jail populations in each state we divided the above (adjusted) numbers by the July 1st U.S. Census Bureau’s Census Vintage Population Estimates, which we have published in Appendix Table 6, and multiplied the result by 100,000 to show an incarceration rate per 100,000 people in each state for each year on the graph. The jail populations used in this report were collected on June 30th (“midyear”) for most years, so we used U.S. Census Bureau population estimates from July 1st for each year. Our state prison incarceration rates come from the Bureau of Justice Statistics, Correctional Statistical Analysis Tool — Prisoners for 1978-2019 and Table 7 of Prisoners in 2020, Prisoners in 2021, and Prisoners in 2022 for 2020-2022. Of note, people sentenced for felonies in the District of Columbia were transferred to the Federal Bureau of Prisons as of December 2001, so there is no prison population or rate for the District for 2001-2022.
For the state graphs of the number of people incarcerated in local jails by conviction status, we calculated estimates of the number of people held for local authorities by conviction status without including people held for federal or state authorities. The Census of Jails does not report the conviction status of people held for other authorities separately from those held for local authorities, so we based our estimate on the only reported ratio of convicted/unconvicted which includes the entire custody population. (We concluded that our national estimates of the portion of people held for state prisons or various federal agencies that are convicted or unconvicted were not reliable at the state level, so we used a simpler methodology for our state graphs.) To create this estimate, we determined the percentages of all people being held in jails in each state who were convicted and unconvicted in the National Jail Census series (1978, 1983, 1988, 1993, 1999, 2005 and 2013). We then subtracted the number of people held for state or federal authorities from the total statewide jail population, and applied our percentage convicted/unconvicted to the remainder. Because most people in jails being held for other authorities are convicted, we believe, our figures likely undercount the unconvicted/pretrial populations and overcount the convicted populations.
For the six states where the federal government can not provide jail counts or conviction status data, we only graphed the state prison portions.
Pretrial detention — for any amount of time — impacts employment, finances, housing, and the well-being of dependent children. In addition, jail stays are life-threatening: from 2000 to 2019, over 20,000 people died in local jails. In 2019 alone, more than one thousand people died in local jails. ↩
Jail stays are increasing in length: in 2022, people spent 8 more days in jail (32.5 days) on average than they did in 2015 (Bureau of Justice Statistics, Jail Inmates in 2022, Appendix Table 1). ↩
When he was 16 years old, Kalief Browder was held in New York City’s Rikers Island jail for three years, including almost two years in solitary confinement, because his family could not afford his $3,000 bail. ↩
Among the 663,100 people in jail on June 30, 2022, 70% (466,100) were unconvicted and held pretrial (Bureau of Justice Statistics, Jail Inmates in 2022, Table 5). However, 2019 is the most recent year for which jail data can be adjusted to exclude the people being held by federal and state authorities. This adjustment of 2019 jail data reveals that in 2019, 76% of the 604,400 people in jail held for local authorities were unconvicted (pretrial). See Figure 1. ↩
For example, in Bladen County, North Carolina, a newly built jail had earned the county nearly $2 million in the first 18 months of renting jail beds to the federal government in 2019. At the time of our 2017 report, a clear example of this pattern took place when officials in Blount County, Tennessee used “jail overcrowding” to justify a 2016 proposal for jail expansion. A deeper analysis, however, revealed that the county’s jail was overcrowded in large part because it was renting space to the state prison system. The county then cut back on renting space to the state prison system and reportedly explored other ways to reduce its jail population in place of jail expansions (we have not found evidence of a new jail or expanded jail in Blount County as of March 2024). ↩
Louisiana’s jail building boom appears to have been entirely fueled by the pursuit of contracts with the state’s prison system. As The Times-Picayune has explained, “In the early 1990s, when the incarceration rate was half what it is now, Louisiana was at a crossroads. Under a federal court order to reduce overcrowding, the state had two choices: Lock up fewer people or build more prisons. […] It achieved the latter, not with new state prisons — there was no money for that — but by encouraging sheriffs to foot the construction bills in return for future profits.” ↩
In terms of the impact on local jail populations, in 2019 (the most recent year with this data) people held in jails for state prison systems accounted for 29% of jail populations statewide in Mississippi, 30% in Louisiana, and 41% in Kentucky (Bureau of Justice Statistics, Prisoners in 2022, Table 14, and Census of Jails, 2005-2019, Table 12). ↩
These detainers, or “immigration holds,” request that local officials notify ICE before a specific individual is released from jail custody and then to keep them there for up to 48 hours after their release date, basically asking local law enforcement to jail people even when there are no criminal charges pending. For more details, see our 2020 explainer on these practices. ↩
For example California, Massachusetts, and Ohio have reduced offenses from minor misdemeanors to non-jailable infractions. ↩
For example, while all states allow citation in lieu of arrest for misdemeanors, only a handful of states permit citations for some felonies or do not broadly exclude felonies. See the National Conference of State Legislatures, 50 State Chart on Citation In Lieu of Arrest, last updated on March 18, 2019. ↩
For example, in Pima County, Arizona, as part of the MacArthur Foundation’s Safety and Justice Challenge, officials have begun screening people for mental health and substance abuse concerns who are arrested before their initial court appearance. Other diversion programs, such as Law Enforcement Assisted Diversion (LEAD) programs, coordinate the efforts of local law enforcement agencies with community-based service providers in counties like Multnomah County, Oregon. For more on LEAD programs, see the Addiction Policy Forum, Center for Health and Justice, National Criminal Justice Association “Innovation Spotlight: Law Enforcement Assisted Diversion.” ↩
For readers wondering when the next state-level data will be collected and published, the Bureau of Justice Statistics is planning a 2024 Census of Jails collection and has proposed replacing the Annual Survey of Jails with a more concise annual Census of Jails thereafter. The data are typically published about two years after collection. ↩
Please note that because our methodology is not the same as the Bureau of Justice Statistics, some numbers used in this publication differ from the published data in the Census of Jails, 2005-2019 — Statistical Tables. ↩
Some of the questions we receive most often about communication policies (and rates) in local jails can finally be answered, thanks to two new resources from Michigan and Minnesota.
How many jails have eliminated in-person visits? How much of a kickback does your average jail get from its telecom providers? How common are tablets in jails and what fees do incarcerated people pay to use them? Because the thousands of local jails in the U.S. are independently run, it’s hard to get comprehensive data to answer questions like these. So it’s encouraging to see two resources get published — out of Michigan and Minnesota, respectively — that will help fill the gap. I summarized my own takeaways from these reports in this blog post.
In Michigan, independent researcher Phil Lombard (using data obtained by requesting jail phone contracts in 40 counties) produced detailed spreadsheets showing the rates county jails are charging incarcerated people and their families for a variety of communication services, and the kickbacks these counties get from their providers. And in Minnesota, following the state legislature’s move last year to make prison phone calls free, the state Ombuds for Corrections published a report in September with similar data from 26 county jails, proving the necessity of reform for jails as well as prisons.
Both of these resources draw on a large and diverse sample of counties — large and small, urban and rural, and geographically varied — making it possible for researchers and activists to generalize from their findings about the state of telecommunications policy in local jails.
So what do the data show?
Video calling and e-messaging costs are desperately in need of regulation.
In both Michigan and Minnesota jails, the cost of these non-phone services vary widely. A 20-minute video call in Minnesota can cost between $3 and $10 (equating to as much as $0.50/minute); in Michigan, between $3 and $20 (or as much as $1/minute). E-messaging in both states ranges from just 9 or 10 cents per message to a bizarre $2 per message. As we have pointed out before about phone calls, the wide range of rates for these services is due to the fact that companies set prices based on profit-seeking, rather than on the cost of delivering the services.
Learn more about jail telecom contracts in Michigan
All 40 Michigan jail phone contracts from which Phil Lombard compiled his dataset are available for the public to read in our Correctional Contracts Library. The Library holds all of the contract documents (contracts, requests for proposals, bids by companies, commission reports, and more) that we and other organizations we work with have obtained. It’s also open to uploads from the public, so if you’re a researcher or advocate and have contracts you’d like to make public, we encourage you to add them to the library and broaden public knowledge of the prison and jail telecom industry!
Thanks to the Martha Wright-Reed Act passed by Congress last year, which confirmed the FCC’s authority to regulate video calls, the agency is required to hand down the first national video calling regulations sometime this year. And while e-messaging is still not subject to federal agency regulation, states have the power — either through legislation or through their public utilities commissions — to set rate caps for these and other telecom services. These reports should make it clear to the FCC and to states that regulating video calling and e-messaging is an urgent matter of consumer protection.
In-person visits and physical mail are disappearing in jails.
In Michigan, coincidentally, a coalition of public interest law firms is currently suing St. Clair and Genesee counties for their practice of banning visits and then cashing in on greater kickbacks from video calling. The new data show that this practice is not a novelty, but the norm in jails today.
A staggering 33 out of 40 jails in the Michigan sample have banned in-person visits (with one, Midland County, noted as having canceled visits specifically at the request of its video calling vendor, Securus). In addition, 20 out of 40 jails have either banned physical mail — following an example set by a disturbing number of state prisons — or restricted families to only sending plain postcards. The Minnesota report is not specific about which jails have banned visits or mail, but notes that “more than half the sample counties we surveyed do not allow in-person visits other than with an attorney.”
Excerpt from a table showing mail, e-messaging, visitation, and video calling rates and policies in a sample of Michigan jails. See the full data here.
The costs families pay would drop dramatically if jails didn’t take commissions.
Some of the most valuable data in these two new reports are the numbers showing that a substantial amount — even, in some counties, the majority — of the money families pay to telecom companies is directly kicked back to the counties themselves.
The Minnesota Ombuds for Corrections’s report provides detailed data tables showing how much families are charged for phone calls, video calls, e-messaging, and voicemail in various counties; as well as how much the counties that offer these services are taking in commissions. Some basic math shows that these kickbacks account for a significant amount of the rates families pay. For instance, the average commission paid to jails for video calling is 39% of total revenue. Vendors build these commissions into their rates, meaning that if jails did not demand these commissions, they could negotiate much lower rates with their providers. The typical Minnesota jail, which charges 29 cents per minute for video calling, could charge just 18 cents per minute if it refused commissions.
Table of video calling rates and commission amounts from the Minnesota Ombuds for Corrections’s “Cost of Connection” report.
Similarly, the Michigan dataset presents commission amounts for a variety of telecom services in many of the 40 sample jails. The average kickback paid to counties for video calling is 32% of total revenue. The average rate families pay to talk to their loved ones via video chat in these jails is 54 cents a minute, but if jails refused commissions, that average would drop to 36 cents per minute.
These two resources also offer insights into aspects of jail telecommunications we haven’t covered in depth before, which advocates might find useful. For instance, the Minnesota report highlights that tablets in some Minnesota jails are being rented to incarcerated people for a weekly or monthly fee, in addition to the well-known fees people pay to use the services on the tablets. And both resources show that people are paying steep fees for voicemail services: For the privilege of leaving an incarcerated loved one a voicemail that typically lasts a minute or less, families are paying around $1.50 on average and as much as $3.95.
These two new resources provide valuable data about jail communication policies and the urgent need for jail phone justice. I hope they will inspire federal and state regulators to take note.
At the Prison Policy Initiative, we’re known for clear, powerful visuals communicating the harms of mass criminalization. We balance context and simplicity to create visualizations that are useful beyond our reports and briefings.
We usually only update our data visualizations about mass incarceration as part of a new report or briefing. However, some graphs are so powerful that they warrant special treatment. In recent months, new data have been released about racial disparities, probation, incarceration, and jail detention. So we’ve updated a few of our most comprehensive and compelling charts to equip advocates, lawmakers, and journalists with the latest information available.
Racial disparities in incarceration
Since 2020, the Bureau of Justice Statistics has reported on more racial and ethnic categories in jail populations, as well as prison populations by sex. These new statistics underscore the ongoing racial injustice of prisons, where the national incarceration rate of Black people is six times the rate of white people and more than twice the rate in every single state.
A few months ago, we released an updated dataset with incarceration rates by race (covering 2021 for prisons and 2019 for jails) for every state and the District of Columbia. Our Racial Justice page also contains reports, briefings, research, and visualizations focused on the intersection of race and mass incarceration.
State policies (still) drive mass incarceration
State-level policies are responsible for incarcerating the vast majority of people in the United States. Recent data show many state prison populations have nearly returned to, or even surpassed, their pre-pandemic levels—highlighting a serious need for policies that will permanently reduce prison populations. (State lawmakers and advocates should check out the high-impact policy ideas we compile every year for our Winnable Battles series.)
The long arms of mass incarceration and supervision
In addition to the 1.2 million people warehoused in prisons, over 650,000 languish in local jails, often as a result of prohibitively high cash bail. There, they may spend weeks, months, or even years in infamously terrible conditions before a decision is reached in their case. As you can see in the first chart below, pretrial detention has driven jail population growth over the past 25 years; at this point, more than two out of three people in jail are legally presumed innocent.
Beyond the 1.9 million people behind bars, millions more are subjected to the greater “mass punishment” system of parole and probation supervision, living in the community but under restrictive and counterproductive rules. More than 2.9 million people on probation and 800,000 people released from prison on parole must live with the constant threat of being jailed over a minor or even noncriminal “technical” violation. And although these populations have decreased somewhat since 2020, they’re still too high and are already rebounding as pandemic-related delays in the courts subside.
One more thing: We’ve also updated the underlying data behind some of these charts in our data toolbox to empower advocates, lawmakers, and journalists to illustrate the consequences of mass incarceration in their communities. If you’re using this data in your work, let us know about it.
The United States' massive practice of incarceration goes almost entirely unchecked. This new resource aims to change that by centralizing news, educational resources, legislative updates, and more to support movements for independent corrections oversight.
Millions of incarcerated people face deadly and abusive conditions every day in the United States because most jailers and prison administrators have free reign over their lives. For many corrections departments, meaningful and effective oversight is the exception, not the rule. Take Oregon, for example: sheriffs inspect each other’s jails and give out perfect scores while reporting record-breaking death counts in their custody. In the state’s prisons, officials have failed to keep track of complaints against corrections staffers and flout requests for information about how often incarcerated people are locked down or experience overdoses.
Courts are basically the only oversight most jails and prisons have–an arrangement that leading oversight scholar Michele Deitch describes as “an anomaly on the world stage.” And courts are not well suited for this job: they’re reactive and narrowly focused on specific complaints, they move slowly, and they’re expensive. Perhaps most importantly, incarcerated people are routinely blocked from using them thanks to laws like the Prison Litigation Reform Act. So, what makes for effective oversight? Which states have oversight bodies and which don’t? And what are the differences between the various models?
Fortunately, PrisonOversight.org is working to answer questions like these, providing critical resources to a movement for more oversight that, according to a recent survey from Families Against Mandatory Minimums, 82% of Americans support. Here, we preview some of the data they’ve collected and encourage you to explore the site and support this essential project.
The state of prison oversight
PrisonOversight.org is a project of the National Resource Center for Correctional Oversight (NRCCO), which supports advocates, policymakers, and government officials in developing and strengthening oversight. Michele Deitch co-runs NRCCO alongside Associate Director Alycia Welch — another leading expert in correctional oversight.
One of the website’s most significant contributions to the movement is a helpful inventory of state-level oversight. According to their map, 19 states and the District of Columbia have an external, independent prison oversight body, while 31 states do not.
PrisonOversight.org’s map shows the patchwork of prison oversight in the United States. Nineteen states and the District of Columbia have some form of prison oversight body, highlighted in blue in the above map.
Each state has a detailed profile that includes the most recent annual budget appropriation for oversight, staff size, structure, and more. According to their data, there is wide variation among the small group of states that have oversight bodies:
Oversight budgets range from $200,000 (Nebraska) to $42 million (California) annually.
Full and part-time staffing ranges from one person (Oregon’s lone ombudsman) to 211 (California); half have ten or fewer staff.
While some are quite old,1 most oversight bodies that exist today were established or re-established after the 1970s; nine have only been around since 2000. Five states have spun up oversight agencies since 2020.
Only three of the 20 oversight bodies were non-governmental organizations.
Four of the oversight bodies are so new that we lack basic information about them, such as their expected staff size, budget, and activities.
NRCCO is developing similar resources about jails and court-ordered oversight bodies that they will publish in the future.
What does effective oversight look like?
In her work analyzing corrections oversight internationally and in the U.S., Deitch notes that “The sheer geographical size of the United States, the enormous number of people incarcerated, and the federalist structure of our correctional system make a single national system of independent oversight impractical.” The best practice, she argues, would be for both state prisons and county jails to receive state-level oversight. She also highlights some helpful attributes of strong and effective oversight bodies. They must:
Be independent of and external to the correctional agency;
Have a mandate to conduct regular, routine inspections;
Have unfettered, “golden key” access to the facilities, incarcerated persons, staff, and records, including the ability to conduct unannounced inspections;
Be adequately resourced, with appropriately trained staff;
Have a duty to report publicly their findings and recommendations;
Use an array of methods of gathering information and evaluating the treatment of incarcerated people;
Be required to cooperate fully in the inspection process and to respond promptly and publicly to the monitoring body’s findings and recommendations; and
Focus monitoring duties on the treatment of incarcerated people and any risks the institution presents to their health, safety, and civil rights.
These lessons are clear in PrisonOversight.org’s design. The website’s helpful Oversight 101 section delves into the basics behind some of these attributes, noting, for example, that layered approaches to oversight are best. One section examines the limitations of leaving everything to the courts or placing too much faith in accreditation alone. There’s information on challenges in practicing oversight, such as insufficient staffing or insulation from political pressure. Helpful resources like model prison oversight legislation and links to recent legislation can help advocates and policymakers keep up with oversight experiments around the country. The Developments section tracks job opportunities in the field, conferences, and news reports.
No more taking impunity in corrections for granted
For hundreds of years in the U.S., incarcerated people have been abandoned to fight for their dignity and safety at the hands of officials who have little interest in or incentive to oblige. They are shunned from society through criminalization and incarceration and then plunged into opaque institutions designed to neglect, if not actively reject, their best interests. Their disappearance from public view perpetuates their abuse while law enforcement and correctional authorities enjoy complete control over what information makes it outside. Independent, external oversight can help shift this balance of power: by collecting and publicizing data on the conditions facing people in these institutions, oversight bodies can help incarcerated people overcome the brutal retaliation they face for speaking out. While enforcement powers vary across these oversight experiments, we all benefit from their ability to provide a meaningful counter to the opportunistic myth-making and rationalizations upon which mass incarceration has thrived.
Resources like PrisonOversight.org are helping to build the momentum for accountability that is long overdue. This project gives advocates helpful information to inform their strategies and public education efforts. It’s also an excellent resource for reporters to learn about what does or does not exist in their state, how oversight bodies work, who serves on them, and what they do and don’t publish. And researchers and policymakers benefit from the collection of state-by-state practices, with a level of detail that allows us to both see the big picture and experiment with different models.
We are grateful that a project like PrisonOversight.org has arrived on the scene. We highly recommend you check out their resources and incorporate the wisdom and recommendations it contains into your campaigns.
Footnotes
Some oversight bodies, like the Correctional Association of New York and the Pennsylvania Prison Society, were established in the 1800s. ↩
We are excited to introduce our new Digital Communications Strategist, Regan Huston! In her new role, Regan will assist the Communications Department in using our social media platforms to raise awareness of the harms of mass incarceration.
Regan is a digital strategist passionate about making sense of the world’s chaos and improving media literacy across all social platforms. She holds a B.J. in Convergence Journalism from the University of Missouri-Columbia. Before joining the Prison Policy Initiative, Regan worked as a Senior Social Media Manager for The Messenger and developed content and social strategies for NowThis and Vice News. She also serves on the board of the iSpeakMedia Foundation which is focused on advancing media literacy education across the nation. She is an experienced digital strategist and we are excited for her to apply her expertise to grow our digital audiences.
New report shows prison and jail populations rebounding after the pandemic and warns of the return of so-called “tough-on-crime” laws
March 14, 2024
Easthampton, Mass. — Ten years after publishing the first edition, today the Prison Policy Initiative released the 2024 version of its flagship report, Mass Incarceration: The Whole Pie. The report provides the most comprehensive picture of how many people are locked up in the U.S., in what types of facilities, and why. In addition to showing that more than 1.9 million people are behind bars on any given day in the U.S., it goes on to bust 10 of the most persistent myths about prisons, jails, crime, and more.
The report includes 34 visualizations of criminal legal system data, exposing long-standing truths about incarceration in the U.S., including:
Many people in jail pretrial are stuck there simply because they’re too poor to pay their cash bail amount.
Black people are overrepresented behind bars, making up about 42% of the prison and jail populations but only 14% of all U.S. residents.
Technical violations — rather than new crimes — are the main reason people on probation or parole are re-incarcerated.
The report also shows that prison and jail populations have continued to rebound from their pre-pandemic lows, reversing a years-long decline in incarceration in the U.S. However, it explains that this growth is not due to increased crime but rather the criminal legal system returning to business as usual after pandemic-related slowdowns and the return of so-called “tough-on-crime” laws.
“The U.S. is at an inflection point in its failed experiment with mass incarceration. After years of progress reducing the number of people behind bars, many of the misguided policies that created this crisis in the first place are being resurrected,” said Peter Wagner, Executive Director of Prison Policy Initiative and co-author of the report. “The choices made by state, local, and federal officials over the next few years will determine whether the country repeats past mistakes or chooses a better path that makes communities safer and reduces the number of people incarcerated.”
Reforming the criminal legal system does not increase crime,
Harsher punishments don’t deter crime, nor make communities safer,
Jails and prisons are not equipped to provide mental health or substance use disorder treatment,
And more.
“Too much of the conventional wisdom — and political rhetoric — about mass incarceration in America is just plain wrong,” said Wendy Sawyer, co-author of the report and research director for the organization. “While politicians and some in the media have found immense success ginning up fear about crime for their self-interests, this report gives the public the truth about what’s happening in the criminal legal system — and the tools to push back on bad faith arguments and lies.”
The original edition of Mass Incarceration: The Whole Pie, released in 2014, provided the first comprehensive view of the systems of criminal confinement in the United States. It helped to fill a critical gap in the movement to end mass incarceration. Since then, the annual report has become a foundational part of hundreds of advocacy campaigns, thousands of news investigations, and countless pieces of legislation that sought to expose the harms of mass incarceration and reduce the number of people behind bars. The organization has also produced versions of the report that look specifically at the incarceration of women and the incarceration of young people.
Report shows the unique and troubling role that jails play in women’s incarceration.
March 5, 2024
190,600 women and girls are locked up in the United States on any given day. That’s the top-line number from the new report Women’s Mass Incarceration: The Whole Pie 2024, released today by the Prison Policy Initiative. However, that number tells only part of the story of women’s incarceration in America. The report dives deep into the data to provide the most recent and comprehensive data on how many women are incarcerated in the U.S., in what kinds of facilities, and why; as well as detailed data on incarcerated women’s demographic makeup and health.
Women in the U.S. experience a dramatically different criminal legal system than men do, but data on their experiences is difficult to find and put into context. The new edition of Women’s Mass Incarceration: The Whole Pie, which the Prison Policy Initiative has published since 2017, fills this gap with richly-annotated data visualizations about women behind bars.
“Like in so many other aspects of life in America, the unique experiences of women in the criminal legal system are obscured by those of men, treated as an afterthought,” said Aleks Kajstura, co-author of the report. “While incarceration impacts all people, tearing them away from their families, damaging their health, and putting an additional financial strain on those already living on a razor’s edge, the criminal legal system is particularly harsh for women in unique and damaging ways.”
“The data in this report should serve as a wake-up call for policymakers. Mass incarceration is failing everyone in the country — and when the country locks up women, the ripple effects are especially devastating,” said Wendy Sawyer, research director for the Prison Policy Initiative and co-author of the report. “Instead of continuing with this failed policy, they should work to address the issues that get women locked up in the first place — poverty, unmet physical and mental health needs, and the over-policing of Black women and girls.”
The report particularly examines the important role of jails in women’s incarceration. 93,000 women are held in jails, and the majority— 51,000 — have not been convicted of a crime. It explains that unaffordable cash bail and a criminal legal system that funnels them into jails after conviction are likely responsible for so many women being held in these facilities. The report goes on to show that jails can be especially deadly for women, with high rates of death from suicide and drug or alcohol intoxication. Additionally, the report highlights that, because they’re generally designed for shorter stays, jails are poorly positioned to provide healthcare for women, and that these facilities make it difficult for women to stay in touch with their families, by charging high rates for phone calls and restricting mail.
Women’s Mass Incarceration: The Whole Pie 2024 also includes a section offering insights about the backgrounds and experiences of women in state prisons. Key takeaways include:
In the U.S., women are held in 446 state prisons, 27 federal prisons, 3,116 local jails, 1,323 juvenile correctional facilities, 80 Indian country jails, and 80 immigration detention facilities, as well as in military prisons, civil commitment centers, and prisons in the U.S. territories.
58% of women in state prisons are parents to minor children, and of those, most are single mothers who were living with their children prior to imprisonment — making it likely that incarceration uprooted their children and led to termination of parental rights, permanently breaking up their families.
Nearly 7,000 young women and girls are caught up in the various systems of confinement. Almost half are held in facilities for the juvenile justice system, and almost as many are unaccompanied migrant children in Office of Refugee Resettlement facilities.
Girls of color and those who identify as LBTQ+ are disproportionately confined by the juvenile justice system. Black girls account for 32% of all girls in juvenile facilities despite making up just 14% of girls under 18 nationwide. Similarly, 40% of girls in the juvenile justice system are lesbian, bisexual, or questioning and gender non-conforming.
Probation and parole play a significant role in the women’s criminal legal system, with an additional 808,700 women under these forms of control. They are forced to live under a complex set of rules and restrictions that set them up to fail and threaten them with reincarceration.
We’ve drilled down into 2019 data to show prison and jail releases by sex in each state and made our best estimates of how many women and men were released from prisons and jails nationwide in 2022.
We often think about incarceration as something only experienced behind bars, but millions of people leave correctional facilities every year in serious need of services and reentry resources. Journalists, advocates, and other users of our website reach out frequently to ask if we know the total number of people released from prisons and jails in their state each year. Many are trying to fight for more resources for people returning home and want to know how these numbers break down by sex. While these are numbers you might expect would be easy to find, they aren’t published regularly in annual reports on prison and jail populations by the Bureau of Justice Statistics (BJS).
In fact, the annual data collected by the federal government about local jails (the Annual Survey of Jails) cannot generally be broken down by state at all; only the more infrequently-collected Census of Jails data can be used to make state-level findings. As for prisons, 2019 is also the latest year for which state-level release data by sex 1 have been published by the Bureau of Justice Statistics. (The total number of people released by each prison system is published annually by the BJS, most recently reporting 2022 data.)
To make this information more accessible, we’ve drilled down into the most recent data available to show how many men and women are released from prisons and jails each year.2
Releases from prisons and jails in 2019, by sex, by state or other jurisdiction
Sources: Bureau of Justice Statistics’ National Prisoner Statistics (for prisons), extracted through the Corrections Statistical Analysis Tool (CSAT), and the 2019 Census of Jails (for jails). Local jail data were weighted and aggregated to the state level by the Prison Policy Initiative. Alaska, Connecticut, Delaware, Hawaii, Rhode Island, and Vermont operate combined or “unified” prison and jail systems, so all releases from correctional facilities in those states are reported by the Bureau of Justice Statistics as prison releases. Alaska is a partial exception among these states, because there are still 14 locally operated jails that report data separately from the unified system.
Deaths in prison, which are generally included in prison release data, were excluded from prison release totals to better reflect the “reentry” population; however, deaths in prisons are not published by sex. As a result, total prison releases will be slightly less than the sum of men’s and women’s prison releases. The number of deaths in federal (BOP) prisons in 2019, subtracted from total releases, comes from Mortality in State and Federal Prisons, 2001-2019 – Statistical Tables. The number of deaths in local jails is not published by the Bureau of Justice Statistics.
Note about District of Columbia: D.C.’s prison population is part of the federal Bureau of Prisons (BOP) system. The BOP releases people to all states and territories, and publishes this data each month on its website.
Men
Women
Totals
Prisons
Jails
Total
Prisons
Jails
Total
Prisons
Jails
Total Releases, 2019
Alabama
10,878
209,401
220,279
2,187
76,060
78,247
12,920
285,461
298,526
Alaska
1,577
4,171
5,748
140
1,113
1,253
1,714
5,284
7,001
Arizona
11,344
142,106
153,450
1,700
47,264
48,964
12,933
189,370
202,414
Arkansas
8,949
124,039
132,988
1,392
46,021
47,413
10,259
170,060
180,401
California
34,976
751,994
786,970
2,888
197,978
200,866
37,462
949,971
987,835
Colorado
8,289
165,718
174,007
1,602
51,879
53,481
9,840
217,597
227,488
Connecticut
4,161
n/a
4,161
319
n/a
319
4,473
n/a
4,480
Delaware
1,981
n/a
1,981
296
n/a
296
2,269
n/a
2,277
District of Columbia
n/a
9,043
9,043
n/a
1,430
1,430
n/a
10,473
10,473
Federal (BOP)
46,320
n/a
46,320
4,738
n/a
4,738
50,677
n/a
50,677
Florida
26,498
500,267
526,765
3,642
156,695
160,337
29,737
656,962
687,102
Georgia
15,311
450,320
465,631
2,044
126,536
128,580
17,200
576,856
594,211
Hawaii
1,408
n/a
1,408
259
n/a
259
1,654
n/a
1,667
Idaho
3,502
51,179
54,681
941
18,889
19,830
4,416
70,068
74,511
Illinois
21,963
197,855
219,818
1,930
56,108
58,038
23,791
253,962
277,855
Indiana
9,499
185,643
195,142
1,586
57,839
59,425
10,988
243,482
254,567
Iowa
6,166
100,482
106,648
969
33,221
34,190
7,114
133,703
140,838
Kansas
5,037
118,963
124,000
1,005
40,370
41,375
6,007
159,332
165,374
Kentucky
15,289
209,733
225,022
4,358
81,721
86,079
19,580
291,455
311,102
Louisiana
15,017
197,568
212,585
1,930
51,763
53,693
16,835
249,332
266,279
Maine
623
23,540
24,163
132
7,492
7,624
755
31,032
31,787
Maryland
6,819
63,722
70,541
649
15,464
16,113
7,408
79,185
86,653
Massachusetts
2,088
52,182
54,270
304
7,295
7,599
2,362
59,477
61,869
Michigan
10,580
217,041
227,621
896
63,300
64,196
11,440
280,341
291,817
Minnesota
6,221
152,126
158,347
811
49,202
50,013
6,964
201,329
208,361
Mississippi
6,247
120,815
127,062
800
29,127
29,927
6,971
149,942
156,989
Missouri
15,350
205,784
221,134
3,271
58,586
61,857
18,533
264,369
282,990
Montana
2,051
31,497
33,548
436
10,927
11,363
2,475
42,423
44,910
Nebraska
2,020
50,662
52,682
333
16,192
16,525
2,336
66,855
69,208
Nevada
5,678
114,718
120,396
1,011
42,302
43,313
6,646
157,020
163,709
New Hampshire
1,166
16,993
18,159
183
5,424
5,607
1,339
22,417
23,766
New Jersey
7,706
101,882
109,588
522
16,867
17,389
8,182
118,749
126,977
New Mexico
2,951
83,350
86,301
595
29,366
29,961
3,528
112,716
116,262
New York
19,482
137,565
157,047
1,421
30,049
31,470
20,791
167,614
188,517
North Carolina
14,924
290,436
305,360
2,291
91,634
93,925
17,106
382,070
399,285
North Dakota
1,085
34,744
35,829
274
11,765
12,039
1,358
46,509
47,868
Ohio
17,727
296,495
314,222
2,683
99,564
102,247
20,275
396,059
416,469
Oklahoma
7,840
152,719
160,559
1,603
54,713
56,316
9,365
207,432
216,875
Oregon
5,099
138,541
143,640
801
44,380
45,181
5,870
182,921
188,821
Pennsylvania
16,256
159,945
176,201
1,800
41,487
43,287
17,897
201,432
219,488
Rhode Island
683
n/a
683
37
n/a
37
720
n/a
720
South Carolina
5,505
142,470
147,975
774
39,364
40,138
6,208
181,834
188,113
South Dakota
3,725
48,612
52,337
868
18,062
18,930
4,576
66,673
71,266
Tennessee
11,728
287,094
298,822
2,576
110,837
113,413
14,205
397,931
412,235
Texas
67,863
776,801
844,664
10,669
217,109
227,778
78,119
993,910
1,072,442
Utah
3,428
72,275
75,703
610
24,688
25,298
4,017
96,963
101,001
Vermont
2,216
n/a
2,216
321
n/a
321
2,528
n/a
2,537
Virginia
10,925
218,493
229,418
1,772
65,724
67,496
12,602
284,217
296,914
Washington
21,807
202,327
224,134
2,684
64,430
67,114
24,455
266,757
291,248
West Virginia
3,465
33,632
37,097
687
12,310
12,997
4,124
45,942
50,094
Wisconsin
5,393
163,160
168,553
471
44,661
45,132
5,820
207,820
213,684
Wyoming
842
21,643
22,485
182
6,779
6,961
1,010
28,422
29,446
Total, 50 states
491,338
7,820,699
8,321,080
71,655
2,373,986
2,445,641
559,177
10,193,255
10,766,721
Total, all jurisdictions
537,658
7,829,742
8,367,400
76,393
2,373,986
2,450,379
609,854
10,203,728
10,817,398
Why we need data disaggregated by sex or gender identity
For years, the mass incarceration of women has been overlooked, even though women’s incarceration has grown at twice the pace of men’s incarceration in recent decades. Women are disproportionately locked up in local jails, where they’re less likely to be able to afford money bail if they’re not convicted, or are more likely to be serving a shorter sentence for a property or drug offense. While there, women in jail experience bleak conditions like expensive phone calls, a lack of programming and education opportunities, and poor quality healthcare.
Being locked up in a state prison also presents a unique set of challenges for women, including the higher chance of being hundreds of miles away from loved ones. No matter how or where a woman is incarcerated, women are generally worse off than men leading up to their incarceration. And entire families are harmed when a woman is put in prison or jail: More than half of incarcerated women are mothers, and women are more likely than men to be primary caregivers to children. Ultimately, keeping women out of correctional facilities and supporting them post-release should be a top priority for lawmakers.
Unfortunately, data regarding women in the criminal legal system are neither updated regularly nor always compatible across years, obscuring our collective view of what’s happening to women in the criminal legal system and how specific reforms impact them. When it comes to gender identity in prisons and jails, the data are even worse, as government surveys typically include trans men under “females” and trans women under “males,” and do not ask further about self-reported gender identity.3 Without better data collection and reporting, the unique needs of women, as well as transgender and nonbinary people, will go on being disregarded in policy and practice.
What’s changed since these data were collected in 2019?
The COVID-19 pandemic caused a dramatic drop in correctional populations in 2020 and 2021 – although this was due to fewer admissions, not more releases – so there have been fewer people eligible for release in the last couple of years. Even though prison and jail populations have unfortunately largely rebounded since then, there were still 29% fewer releases from prisons and jails in 2022 compared to 2019.4 Because of this dramatic difference from 2019, we also calculated rough estimates of releases by sex in 2022 on the national level for those interested in what more recent release numbers look like:
Estimated releases from prisons and jails, by sex, in 2022
With the exception of the total releases from prisons, all numbers are estimates based on 2019 data and should be used with caution. Details may not sum to totals due to rounding.
Men
Women
Total
Releases from state and federal prisons (excluding deaths)
388,355
55,179
443,534
Releases from local jails
5,537,103
1,678,855
7,215,958
Releases from all prisons and jails
5,925,457
1,734,034
7,659,492
To estimate what 2022 releases from prisons might look like by sex, we started with the number of state and federal prison releases, excluding deaths, reported in 2022 by the Bureau of Justice Statistics: 443,534.5 We then used the 2019 data to find the percentage of all prison releases that were from female prisons, which was about 12%; this percentage was based on all releases including deaths, because deaths in prison aren’t reported by sex. Applying this percentage to total prison releases in 2022, we estimate that about 55,179 people were released from female state and federal prisons in 2022, of which about 3,951 were from federal prisons.6
To estimate the number of releases from local jails in 2022 by sex, we first had to estimate the number of total releases, which the Bureau of Justice Statistics did not publish. We started with the number of jail admissions reported for that year: 7.3 million, according to the Bureau of Justice Statistics.7 Most people are jailed for a relatively short time, typically released from jail the same year they are admitted, so we would expect the number of admissions to be very close to the number of releases.8 In 2019, there were just 1.15% fewer people released from jails nationwide than were admitted that year. We applied this percentage to the 7.3 million jail admissions in 2022, arriving at an estimated 7,215,958 releases from local jails in 2022. To estimate how many of those releases were women, we calculated the percentage of all jail releases in 2019 that were women (23%) and applied that percentage to our estimate for total jail releases in 2022. Because there is no national source of data for jail deaths in 2022, we could not exclude deaths from these estimates of jail releases.
Opportunities for further data analysis
We also get lots of questions about the number of people released to local communities (counties, cities, et cetera). While we don’t have a solution that works for every state, we do suggest two different ways to generate estimates in our previous briefing about releases.
Data collection efforts regarding incarcerated women are slowly improving in some areas: For example, the Bureau of Justice Statistics is considering adding questions about pregnancy and maternal health in its national surveys of correctional facilities. In the meantime, we hope this dataset is useful in your advocacy work. The 2019 release data can be accessed from our Data Toolbox; for more information about mass incarceration in your state, see our State Profiles pages.
Footnotes
Even the available data that are disaggregated by sex are frustratingly limited, in that they typically only differentiate between “male” and “female,” ignoring the reality that the gender identities of confined people (and all people, for that matter) are not limited to this binary. This field of research has a long way to go before the data are consistently collected and reported by gender identity rather than an administrative categorization of “male” versus “female.” ↩
Astute readers will notice that male and female releases sum up to more than the total number of releases in a state. This discrepancy occurs because the Bureau of Justice Statistics does not publish the number of deaths — which count as a form of “release” — by sex. We removed the number “released” due to death from the total prison releases to better reflect the number of people in the reentry population in each state, but could not do the same calculation by sex. If you are able to find the number of male or female deaths in your state’s prisons or jails in 2019, you can get slightly closer to the number of people released. ↩
In state and federal prisons in 2022, there were 443,534 releases (excluding deaths), a 27% decrease from 609,869 in 2019. In jails, we estimate there were about 7,215,958 releases in 2022, and 10,203,728 releases in 2019, a 29% difference. (Because BJS published only the number of admissions to – and not releases from – jails for 2022, we calculated our own estimate for releases in 2022. To do so, we first calculated the ratio of annual releases to annual admissions in 2019 (98.85%), and then applied that ratio to the published estimate of admissions in 2022 (7,300,000), arriving at our 7,215,958 estimated releases.) ↩
We did not attempt state-level estimates by sex for 2022 because the number of women released from some state prisons in 2019 was quite small. For example, just 37 sentenced women were released in Rhode Island that year, and several other states reported fewer than 200 female releases. Because of these small numbers, even small changes in the distribution of releases by sex from 2019 to 2022 would have a sizable impact on the accuracy of our state-level estimates. However, if any readers are looking for back-of-the-envelope estimates at the state level, they could follow the logic of our methodology for our national estimates using the state-level data from 2019. ↩


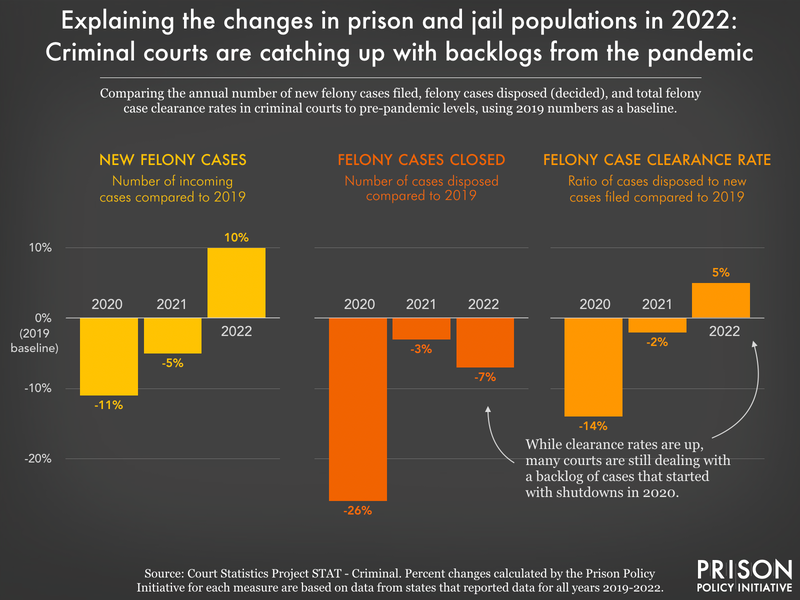